Leadership & ManagementBeginner / Basic10 minutes
Updated
200+ KPIs for measuring Businesses and every Department
We explain KPIs, incl. differences, and share a list of over 200+ KPIs for every department and occasion. Measuring the right Performance Indicators can help you better manage your company, and using KPIs is the basis for data-driven decision-making.
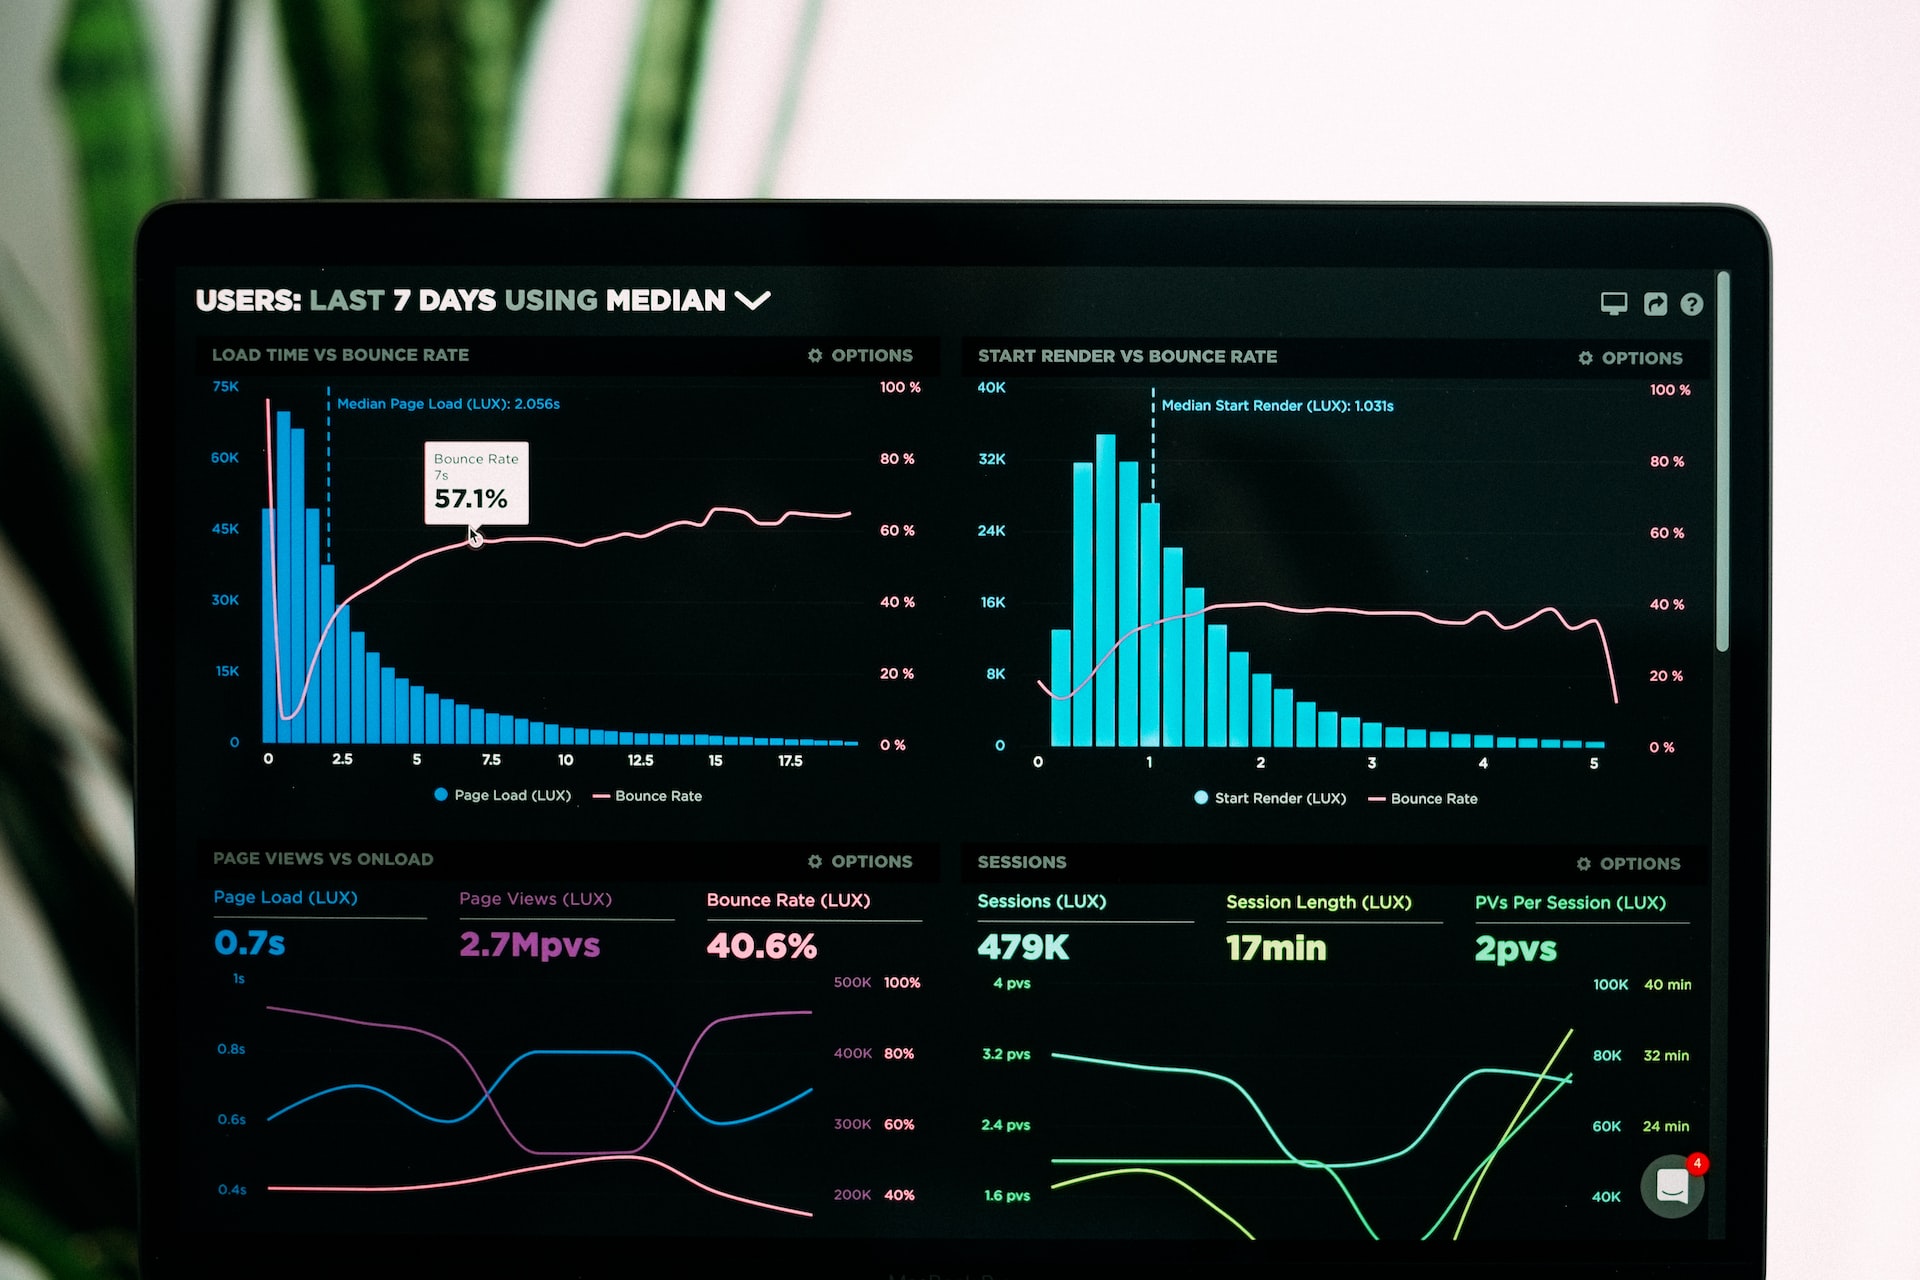
What are KPIs? KPI stands for "Key Performance Indicator." It is a metric or statistic that you track to measure the progress of your business. A KPI can be anything from customer satisfaction rates to website traffic. In this blog post, we will discuss the meaning of KPIs, the different types of KPIs, and some examples of how to track them.
What is a KPI?
A Key Performance Indicator (KPI) is a metric used to measure an organization's or individual's progress or success concerning a specific goal. KPIs can measure any aspect of an organization or individual, such as revenue, profit, customer satisfaction, employee satisfaction, etc.
Businesses often use KPIs to make data-driven decisions. By tracking KPIs, companies can see what is working and needs improvement. Any business's strategy to manage, track, and use KPIs is essential. Without one, making informed decisions about the company's future can be challenging.
There are several different ways to track KPIs. Some businesses use software applications (e.g., Salesforce, Google Analytics, Tableau) to collect and track data automatically. Others prefer manual methods, such as Excel spreadsheets or paper-based reporting. Collecting and analyzing your data is not essential as long as you follow the suitable KPIs and use them to make data-driven management decisions.
Read the full article here: What are KPIs? - Definition, Types, Benefits of Key Performance Indicators (KPIs)
What are the different types of KPIs?
There are different types of KPIs: Quantitative vs. Qualitative, Strategic vs. Operational, Input vs. Output, Lagging vs. Leading, and Process vs. Actionable.
Quantitative KPIs are numerical and focus on the results of a process. They usually measure financial or statistical performance indicators. Qualitative KPIs are descriptive and focus on the quality of a process. They typically measure customer satisfaction or employee engagement levels.
Strategic KPIs are important for understanding the overall direction of a business. They help to track progress toward long-term goals and objectives. Operational KPIs are useful for monitoring the day-to-day activities of a company. They help to ensure that critical processes are running smoothly.
Input KPIs track the resources that are used to produce outputs. This includes things like labor costs, raw materials, and energy consumption. Output KPIs track the final results of a process. This includes sales revenue, product shipments, and customer satisfaction levels.
Lagging KPIs are used to measure performance after an event has occurred. This includes things like sales revenue and profit margins. Leading KPIs are used to measure performance before an event has occurred. This includes things like product development times and customer acquisition costs.
Process KPIs track the individual steps in a process. This includes things like cycle time and percent of defective products. Actionable KPIs provide insights that can be used to improve a process. An example can be the average processing time and throughput rate.
KPIs are a valuable tool for measuring and managing business performance. However, it is vital to select suitable KPIs for your business. The wrong KPIs can lead to poor decision-making and sub-optimal results.
Selecting the right KPIs
When selecting KPIs, you should consider the following:
What is essential to track in your business?
What are your goals and objectives?
What data do you have available?
How often do you need to measure performance?
Who will be using the KPIs?
These questions will help you identify suitable KPIs for your business. Once you have selected the correct KPIs, you need to track them over time. This will help you recognize trends and patterns in your data.
It is also essential to not just give everyone the same KPIs. They depend on department, seniority, and function—the more relevant, the more impact. To build a data-driven organization, everyone must understand how their KPIs link to the company strategy and what needs to be done to impact them. By integrating KPIs into the tools and platforms the team is already using, such as their CRM or project management tool, you can ensure that they are always top of mind.
Keep in mind: When it comes to KPIs, more is not always better. A small number of well-chosen KPIs will provide more insights than a large number of poorly chosen KPIs.
SMARTER Criteria for choosing KPIs
When selecting KPIs, you can use the SMARTER criteria to evaluate the right one (Specific, Measurable, Attainable, Relevant, Time-bound, Evaluate, Reevaluate). This is the extension of SMART criteria used in Project Management and can help for selecting suitable KPIs.
KPIs should be:
Specific: The KPI should be clearly defined and easy to understand.
Measurable: The KPI should be quantifiable to be tracked over time.
Attainable: The KPI should be realistic and achievable.
Relevant: The KPI should be relevant to the business goals and objectives.
Time-bound: The KPI should have a timeframe associated with it.
Evaluate: The KPI should be reviewed regularly to remain valid.
Reevaluate: The KPI should be reevaluated if there are changes in the business environment.
Creating a Mindset for Data-Driven Decision-Making
Making data-driven decisions is essential for success in any field. However, we must first have the right mindset to make effective decisions. We must be able to objectively analyze data and use it to inform our decision-making process. This can be difficult if we are biased or emotionally attached to a particular outcome.
To make data-driven decisions, we must be willing to change our opinions when new information arises. We must also be able to accept criticism and feedback, both from others and from our data. If we cannot do these things, we will be unable to make effective decisions using data.
It is also important to remember that data is not perfect. It can be incomplete, inaccurate, or misinterpreted. However, using data correctly can still be a valuable tool in our decision-making process. We must be careful not to let our biases and preconceptions cloud our judgment when reviewing data. Instead, we must use data to challenge our assumptions and help us see the world in a new light.
If we learn to adopt the right mindset, we can use data to make better decisions and succeed in any field. Data-driven decision-making (DDDM) is a process in which decisions are made based on data and analytics rather than intuition or experience.
List of 200+ important KPIs for Organizations
There is no one-size-fits-all answer to which key performance indicators (KPIs) are most important for your organization. However, some KPIs are universally important, regardless of your business or industry. And then there are also KPIs that will be specific to your organization and its goals.
That said, here is a list of more than 200 important KPIs, organized by topic and department. This list should give you a good starting point for determining which KPIs are most relevant to your organization.
Strategic Management KPIs
Revenue
Revenue per Employee / Revenue per FTE
Total Costs
Net Income
Profit Margin
Operating Margin
Gross Margin
Customer Acquisition Costs (CAC)
Customer Lifetime Value
Customer Satisfaction Score / Net Promoter Score
Customer Churn Rate
Sales by Product or Service
Sales Target in % (Actual/Forecast
Operating Expenses Ratio
Net Profit Margin Percentage
Return on Assets (ROA)
Return on Equity (ROE)
P/E Ratio
Current Ratio (Assets/Liabilities)
Debt to Equity Ratio
Working Capital
Employee Satisfaction Rating
Sales KPIs
Sales Growth (YoY, QoQ. MoM)
Sales Target %
Customer Acquisition Cost (CAC)
Customer Churn Rate
Lead Response Time
Lead Conversion %
Lead to Opportunity Conversion %
New Qualified Opportunities
Total Pipeline Value
Lead-to-Opportunity %
Opportunity-to-Order %
Average Order/Purchase Value
Average Sales Cycle Time / LenghtUpsell %
Cross-Sell %
Sales Volume by Location
Revenue per Sales Rep
Profit Maring per Sales Rep
Operations KPIs
Labor Utilization
Employee Turnover Rate
Employee Absence Rate
Employee Training Rate
ROI of Outsourcing
Labor Materials
Operating Margins
Customer Lifetime Value
Processes and Procedures Developed
Cash Flow
Project Schedule Variance
Order Fulfilment Cycle Time
Delivery In Full On Time Rate
Rework Rate
Customer Complaints
Project Management KPIs
On-Time Completion %
Milestones on Time %
Estimate to Project Completion
Adjustments To Schedule
Planned vs. Actual Hours
Resource Capacity %
Budget Variance (Planned vs. Actual)
Budget Iterations
Planned Value
Net Promoter Score
Number of Errors
Customer Complaints
Change Requests
Billable Utilization
Return On Investment (ROI)
Marketing KPIs
Total Revenue
Revenue by Product or Service
New Customers
Cost per Acquisition (CPA)
Cost per Lead
Sales Target & Growth
Average Order Value
Upsell & Cross-Sell Rates
Customer Lifetime Value (CLTV)
Organic Traffic
Bounce Rate
Engagement Rate
Click-Through-Rate (CTR)
Goal Conversion Rates
Website-Traffic-to-Lead Ratio
Marketing Qualified Leads (MQLs)
Sales Qualified Leads (SQLs)
Lead-to-MQL Ratio
MQL-to-SQL Ratio
Average Time to Conversion
Landing Page Conversion Rates
Cost-per-Click (CPC)
Return on Investment (ROI)
Return on Ad Spend (ROAS)
Net Promoter Score (NPS)
Human Resources KPIs
Absenteeism rate
ROI of outsourcing
Succession planning rate
Open/closed grievances
Promotion rate
Female to Male Ratio
Average Time Stay
Time to productivity
Successor gap rate
Worker composition by gender, experience, and tenure
Internal mobility
Manager quality index
HR effectiveness
Employee satisfaction rates
Training ROI
Gender Diversity By Role
Part-Time Employees
HR functional operating expense rate
Labor cost per FTE
Labor cost revenue percent
Labor cost revenue expense percent
Total benefits as a percentage of labor costs
Overtime Hours
Revenue per FTE
Profit vs. compensation per FTE
Human capital ROI
HR functional cost per employee
Cost per Hire
Quality of hire
Vacancy rate
Turnover rate
Turnover Rate By Group
Training Cost per Hire
Resignation/retirement rate
External hire rate
Time-to-fill
Diversity, experience, and gender hire ratio
Recruiting funnel metrics
Talent import/export ratio
Voluntary turnover rate
Retention rate
Recruiting expense per new hire
Retirement rate forecast
Customer Service & Support KPIs
Customer Churn
Top Agents
Service Level
MRR Growth Rate
Number of Issues (By Type)
First Response Time (FRT)
First Contact Resolution Rate
Average Response Time
Average Resolution Time
Most Active Support Agents
Cost Per Conversation
Customer Satisfaction Score (CSAT)
Net Promoter Score (NPS)
Positive Customer Reviews
Customer Effort Score
Customer Retention Rate
Support Costs / Revenue Ratio
Knowledge Base Articles
Employee Engagement
Procurement KPIs
Compliance Rate
Number of Suppliers
Purchase Order Cycle Time
Supplier Quality Rating
Supplier Availability
Supplier Defect Rate
Vendor Rejection Rate & Costs
Lead Time
Emergency Purchase Ratio
Purchases In Time & Budget:
Cost of Purchase Order
Procurement Cost Reduction
Procurement Cost Avoidance
Spend Under Management
Procurement ROI
IT & Technology KPIs
IT Costs vs. Revenue
IT Team Turnover
Total Tickets vs Open Tickets
Average Handle Time
Total Support Tickets
Open Support Tickets
Ticket Resolution Time
Reopened Tickets
Unsolved Tickets Per Employee
IT Support Employees per End Users
Total Projects
Projects on Budget
Accuracy of Estimates
IT ROI
IT Costs Break Down
New Developed Features
Number of Critical Bugs
Team Attrition Rate
IT Support Employees Per End Users
Uptime %
Server Downtime
Security Related Downtime
Backup Frequency
Cybersecurity Rating
Amount Of Intrusion Attempts
Mean Time To Detect
Mean Time To Repair
Average Time Between Failures
Phishing Test Success Rate
Social Media KPIs
Social Share of Voice (SSoV)
Total Reach
Total Impressions
Followers, or Fans, or Subscribers
Audience Growth Rate
Share Rate (Shares or ReTweets)
Interest Rate (Likes, Reactions, Favorites)
Response Rate (Comments, Replies)
Key Post or Hashtag Reach
Link Clicks
Site Traffic From Social (By Platform)
Conversions From Social (#)
Conversion Rate From Social (%)
Revenue From Social (#)
Social Program ROI
Financial KPIs
Gross Profit Margin
Gross Profit Margin Percentage
Operating Profit Margin
Operating Profit Margin Percentage
Net Profit Margin
Net Profit Margin Percentage
Operating Expense Ratio
Working Capital Ratio
Debt-To-Equity Ratio
Quick Ratio / Acid Test
Current Ratio
Berry Ratio
Return on Assets
Return on Equity
Cash Conversion Cycle
Accounts Payable Turnover Ratio
Accounts Receivable Turnover Ratio
Vendor Payment Error Rate
Budget Variance
Payroll Headcount Ratio
Source of List: MoreThanDigital Insights
Author: Benjamin Talin, CEO MoreThanDigital
Topics
Share article
Cite this article
Use the reference below when citing this article.
MoreThanDigital Insights (2022). 200+ KPIs for measuring Businesses and every Department. MoreThanDigital. ISSN 2673-1754. https://morethandigital.info/what-are-kpis-meaning-definition-and-examples
- Published
- 10 Oct 2022
- Updated
- 30 Jul 2026
- Original language
- EN
- Also available in
- DE
Written by
author

